cols4all is an R package for selecting color palettes. “Color for all” refers to our mission that colors should be usable for not just people with normal color vision, but also for people with color vision deficiency. Currently, this package contains palettes from several popular and lesser known color palette series. Own palettes series can be added as well.
Color palettes are well organized and made consistent with each other. Moreover, they are scored on several aspects: color-blind-friendliness, the presence of intense colors (which should be avoided), the overall aesthetic harmony, and how many different hues are used. Finally, for each color palette a color for missing values is assigned, which is especially important for spatial data visualization. Currently we support several types: categorical (qualitative) palettes, sequential palettes, diverging palettes, and bivariate palettes (divided into four subtypes).
Installation
cols4all is available on CRAN:
install.packages("cols4all", dependencies = TRUE)The development version can be installed as follows:
install.packages("remotes")
remotes::install_github("mtennekes/cols4all", dependencies = TRUE)
Getting started
Load the package:
The main tool is a dashboard, which is started with:
c4a_gui()
What types and series are available?
c4a_types()
#>   type                          description
#> 1  cat                          categorical
#> 2  seq                           sequential
#> 3  div                            diverging
#> 4 bivs  bivariate (sequential x sequential)
#> 5 bivc bivariate (sequential x categorical)
#> 6 bivd   bivariate (sequential x diverging)
#> 7 bivg bivariate (sequential x desaturated)

c4a_series()
#>     series                                         description
#> 1   brewer                                ColorBrewer palettes
#> 2      c4a                  cols4all palettes (in development)
#> 3    carto                          Palettes designed by CARTO
#> 4      hcl  Palettes from the Hue Chroma Luminance color space
#> 5   kovesi                   Palettes designed by Peter Kovesi
#> 6      met Palettes inspired by The Metropolitan Museum of Art
#> 7     misc                              Miscellaneous palettes
#> 8    miscs                                                <NA>
#> 9    parks                 Palettes inspired by National Parks
#> 10    poly               Qualitative palettes with many colors
#> 11   scico     Scientific colour map palettes by Fabio Crameri
#> 12 seaborn            Palettes from the Python library Seaborn
#> 13 stevens                Bivariate palettes by Joshua Stevens
#> 14 tableau                        Palettes designed by Tableau
#> 15     tol                       Palettes designed by Paul Tol
#> 16 viridis          Palettes fom the Python library matplotlib
#> 17     wes                   Palettes from Wes Anderson movies
How many palettes per type x series?
c4a_overview()
#>         cat seq div bivs bivc bivd bivg
#> brewer    8  18   9    2    1    1   NA
#> c4a      NA  NA   2    2   NA    2    5
#> carto     6  21   7   NA   NA   NA   NA
#> hcl       9  23  11   NA   NA   NA   NA
#> kovesi   NA  17  13   NA   NA   NA   NA
#> met      33   8  14   NA    1   NA   NA
#> misc      1  NA  NA   NA    3   NA   NA
#> miscs     4  NA  NA   NA   NA   NA   NA
#> parks    22   5   3   NA   NA   NA   NA
#> poly      9  NA  NA   NA   NA   NA   NA
#> scico    21  21  10   NA    2   NA    1
#> seaborn   6   4   2   NA   NA   NA   NA
#> stevens  NA  NA  NA    5   NA   NA   NA
#> tableau  29  23  28   NA   NA   NA   NA
#> tol       8   8   4   NA   NA   NA   NA
#> viridis  NA   7   1   NA   NA   NA   NA
#> wes      23  NA   1   NA   NA   NA   NA
What palettes are available, e.g diverging from the hcl series?
# Diverging palettes from the 'hcl' series
c4a_palettes(type = "div", series = "hcl")
#>  [1] "hcl.blue_red1"    "hcl.blue_red2"    "hcl.blue_red3"    "hcl.red_green"
#>  [5] "hcl.purple_green" "hcl.purple_brown" "hcl.green_brown"  "hcl.blue_yellow2"
#>  [9] "hcl.blue_yellow3" "hcl.green_orange" "hcl.cyan_magenta"
Give me the colors!
# select purple green palette from the hcl series:
c4a("hcl.purple_green", 11)
#>  [1] "#492050" "#82498C" "#B574C2" "#D2A9DB" "#E8D4ED" "#F1F1F1" "#C8E1C9"
#>  [8] "#91C392" "#4E9D4F" "#256C26" "#023903"

# get the associated color for missing values
c4a_na("hcl.purple_green")
#> [1] "#868686"
Plot these colors:
c4a_plot("hcl.purple_green", 11, include.na = TRUE)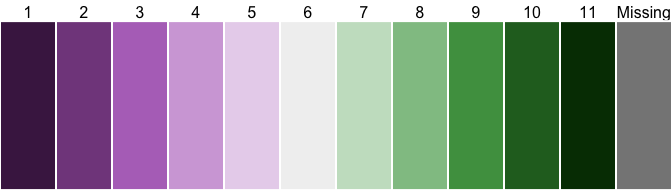
Using cols4all palettes in ggplot2
library(ggplot2)
data("diamonds")
diam_exp = diamonds[diamonds$price >= 15000, ]

# discrete categorical scale
ggplot(diam_exp, aes(x = carat, y = price, color = color)) +
    geom_point(size = 2) +
    scale_color_discrete_c4a_cat("carto.safe") +
    theme_light()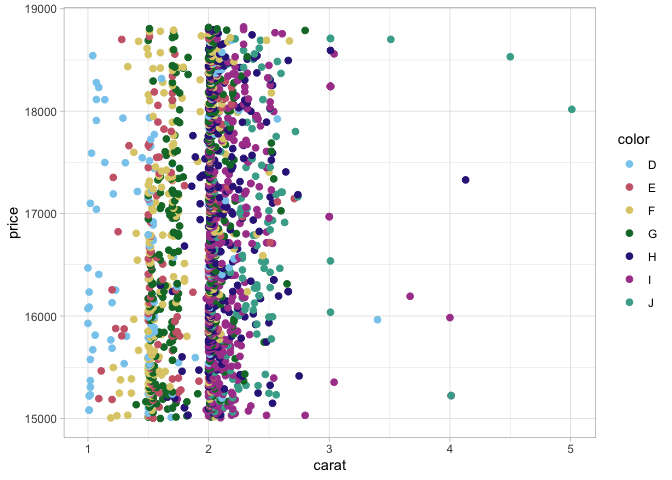
# continuous diverging scale
ggplot(diam_exp, aes(x = carat, y = depth, color = price)) +
    geom_point(size = 2) +
    scale_color_continuous_c4a_div("wes.zissou1", mid = mean(diam_exp$price)) +
    theme_light()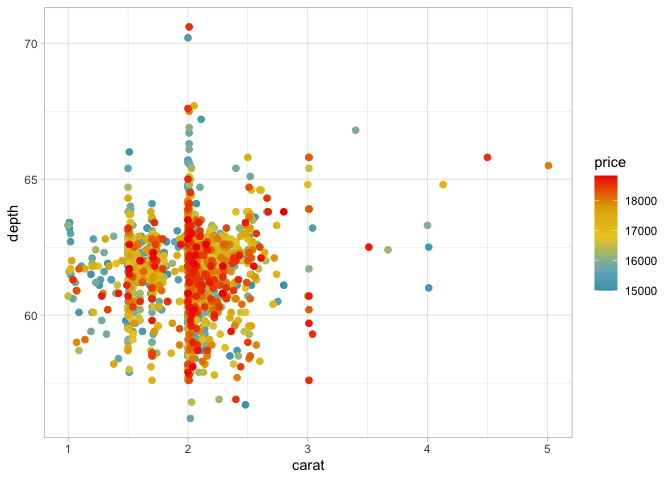
Overview of functions
Main functions:
-
c4a_guiDashboard for analyzing the palettes -
c4aGet the colors from a palette (c4a_nafor the associated color for missing values) -
c4a_plotPlot a color palette
Palette names and properties:
-
c4a_palettesGet available palette names -
c4a_seriesGet available series names -
c4a_typesGet implemented types -
c4a_overviewGet an overview of palettes per series x type. -
c4a_citationShow how to cite palettes (with bibtex code). -
c4a_infoGet information from a palette, such as type and maximum number of colors -
.PEnvironment via which palette names can be browsed with auto-completion (using$)
Importing and exporting palettes:
-
c4a_dataBuild color palette data -
c4a_loadLoad color palette data -
c4a_sysdata_importImport system data -
c4a_sysdata_exportExport system data
Edit color palette data
-
c4a_duplicateDuplicates a color palette -
c4a_modifyModifies palette colors
ggplot2
-
scale_<aesthetic>_<mapping>_c4a_<type>e.g.scale_color_continuous_c4a_divAdd scale to ggplot2.
Related R packages
The foundation of this package is another R package: colorspace. We use this package to analyse colors. For this purpose and specifically for color blind friendliness checks, we also use colorblindcheck.
There are a few other pacakges with a large collection of color palettes, in particular pals and paletteer. There are a few features that distinguishes cols4all from those packages:
Color palettes are characterized and analysed. Properties such as color blindness, fairness (whether colors stand out about equally), and contrast are determined for each palette.
Bivariate color palettes are available (besides the three main palette types: categorical, sequential, and diverging).
Own color palettes can be loaded and analysed.
Color for missing values are made explicit.
Palettes are made consistent with each other to enable comparison. For instance, black and white are (by default) removed from categorical palettes. Another standard that we adapt to is that all sequential palettes go from light to dark and not the other way round.
There is native support for ggplot2 and tmap (as of the upcoming version 4).
There are a couple of exporting options, including (bibtex) citation.