Plot a color palette, either a cols4all palette, or a color vector. c4a_plot_cvd is a shortcut to include color-blind simulated colors, `c4a_plot_hex is a shortcut to print hex codes instead of labels.
Usage
c4a_plot(
  palette,
  ...,
  dark = FALSE,
  include.na = FALSE,
  hex = FALSE,
  include.cvd = FALSE,
  nrows = NA,
  ncols = NA
)

c4a_plot_cvd(...)

c4a_plot_hex(...)
Arguments
- palette
Palette name (see
c4a) or a color vector- ...
arguments passed on to
c4a- dark
dark (black) background?
- include.na
should a color for missing values be included?
- hex
should hex codes be printed instead of color labels (or numbers)?
- include.cvd
should color deficiency simulated colors be included?
- nrows, ncols
Number of rows and columns. Ignored if
include.cvd = TRUE(in that case, rows are used for the simulated colors). By default automatically calculated based on aspect ratio of the device.
Value
Besides the plot, a gTree is returned silently
Examples
c4a_plot("brewer.set1", nrows=1)
 c4a_plot_hex("brewer.set1", nrows=1)
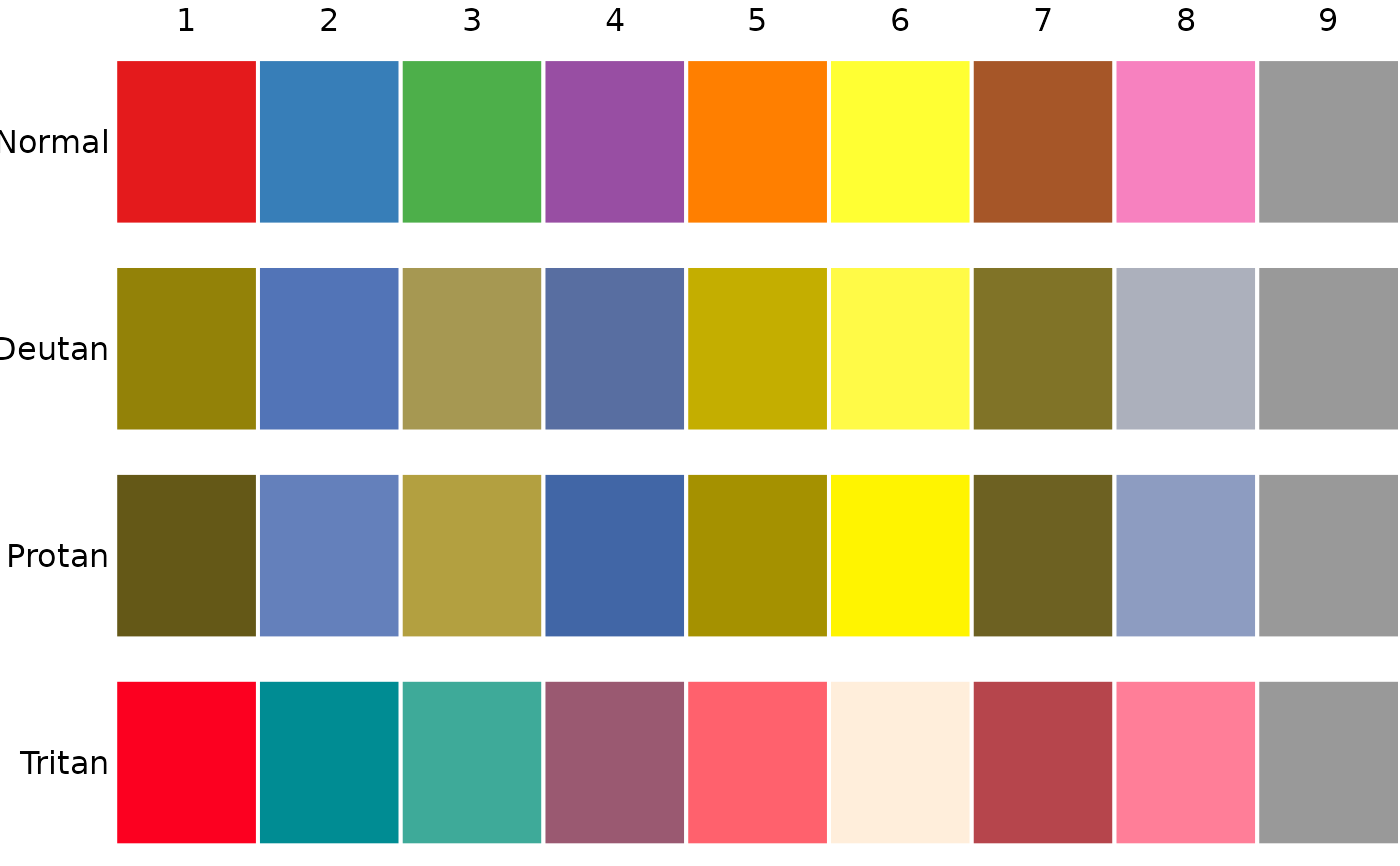
 c4a_plot_cvd("brewer.set1")
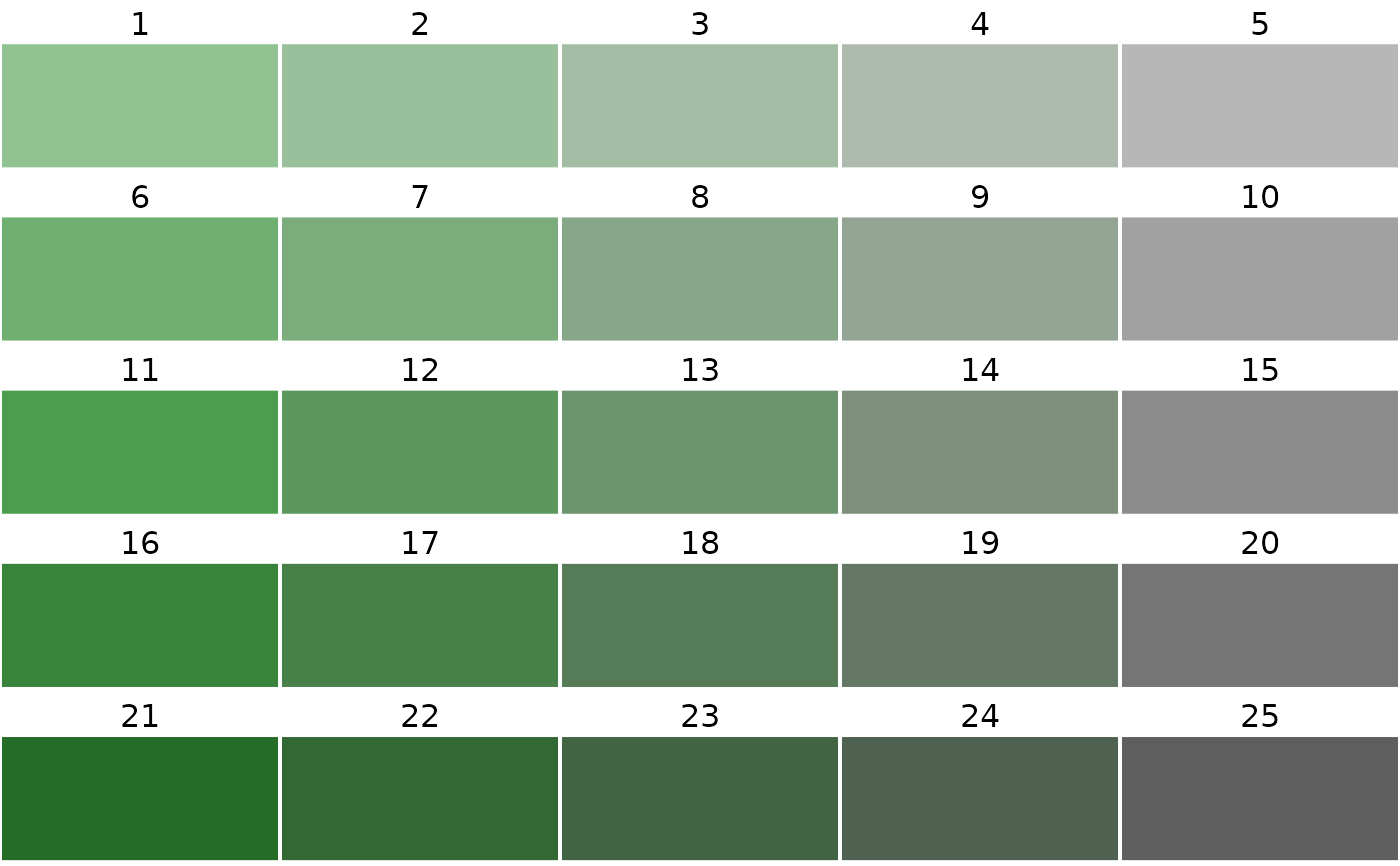
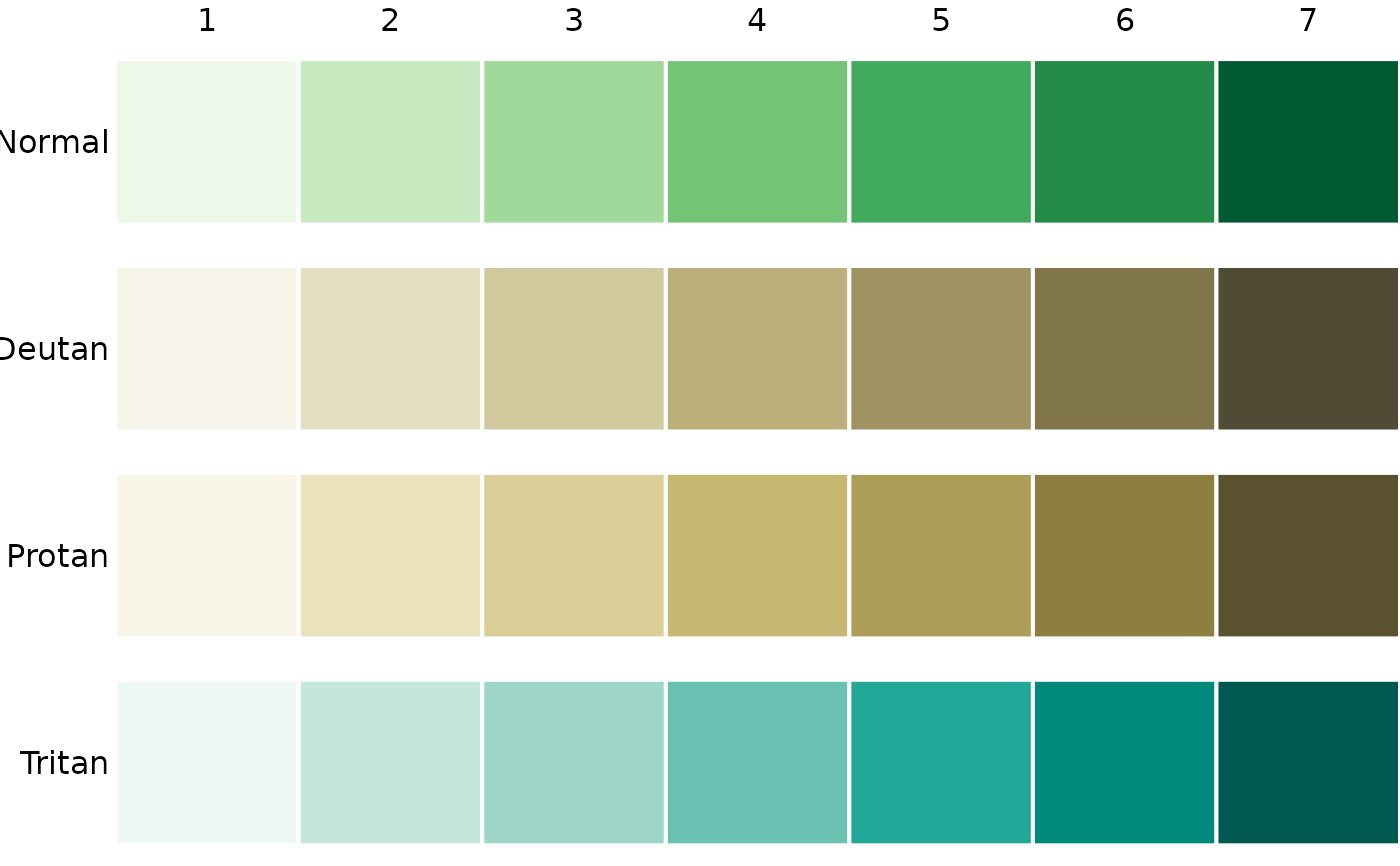
 c4a_plot_cvd("greens")
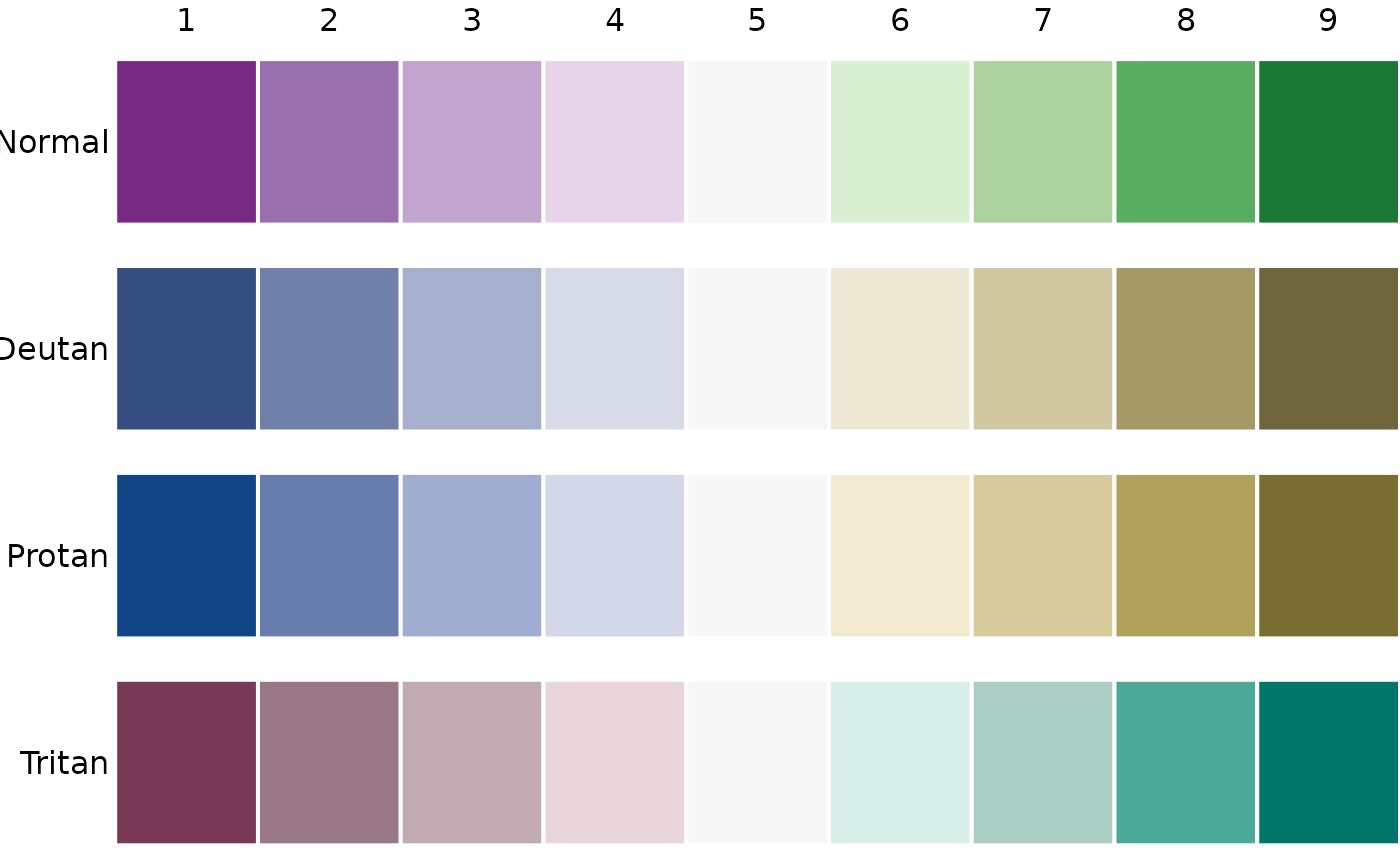
 c4a_plot_cvd("tol.pu_gn")
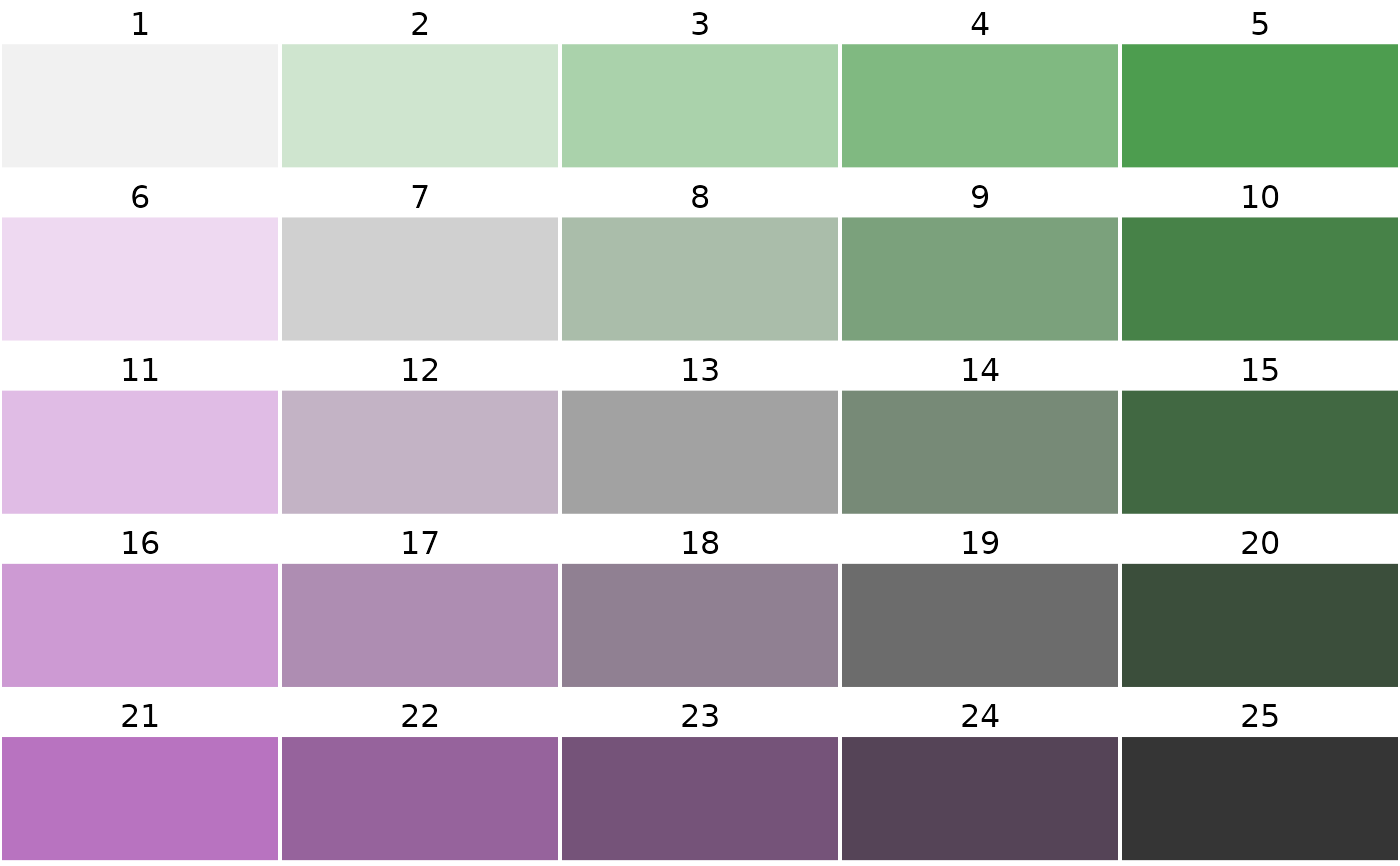
 c4a_plot(.P$cols4all$bivs$pu_gn_bivs, n = 5)
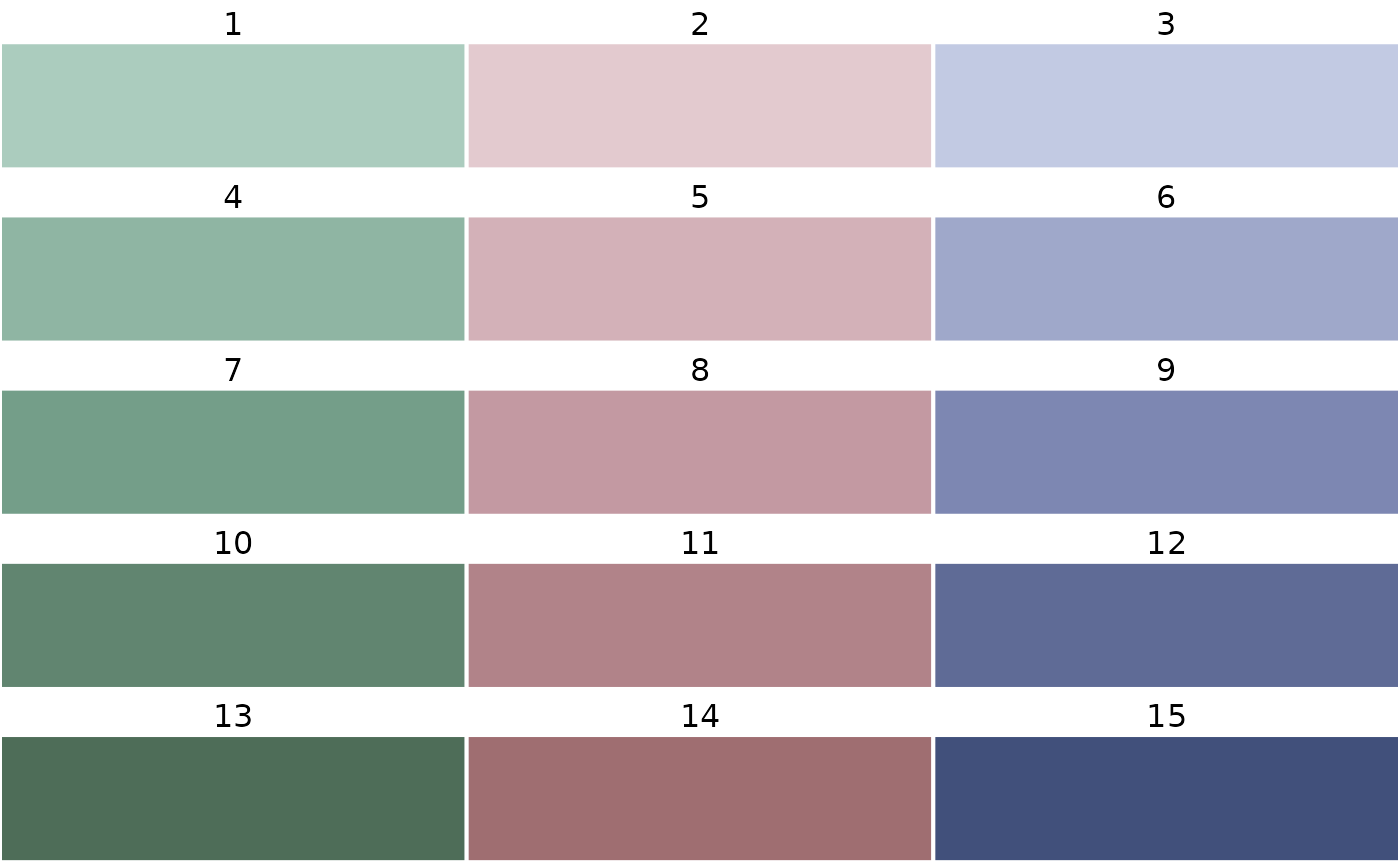
 c4a_plot(.P$met$bivc$monet)
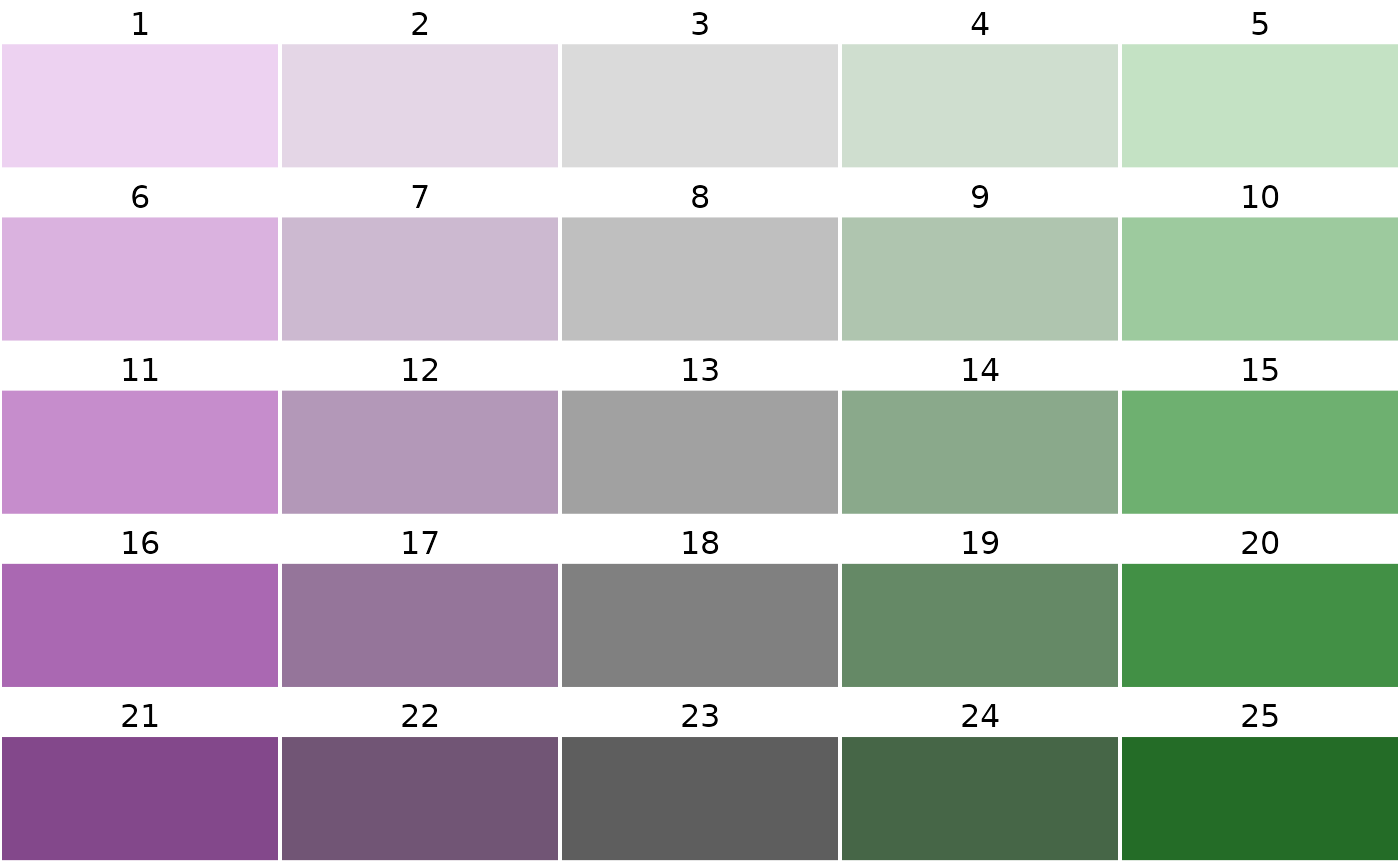
 c4a_plot(.P$cols4all$bivd$pu_gn_bivd, n = 5)
 c4a_plot(.P$cols4all$bivg$gn_bivg, n = 5)